Changing Diagnostic Limits in VAG EDC16
27.03.2025Before discussing the modification of diagnostic limits, I will provide some general information:
Automotive computers (ECUs) have built-in functionality for diagnosing sensor-measured values. This is implemented through so-called measuring blocks. VCDS requests the ECU to deliver four blocks of measured values via group measurement. The groups range from 1 to 255. Which four measured values are delivered in a group varies depending on the ECU model.
The data of each measuring block is defined by three bytes: ID (identifier), A, and B (values).
- The identifier for the type of measured value (ID) is always transmitted before the measured values.
- The measured values are always divided into two bytes (A, B).
- The actual measured value we see in VCDS is created from bytes A and B using an arithmetic operation – a formula. The arithmetic operation varies depending on the ID (sensor type).
Here are some identifiers and their equivalent calculation formulas:
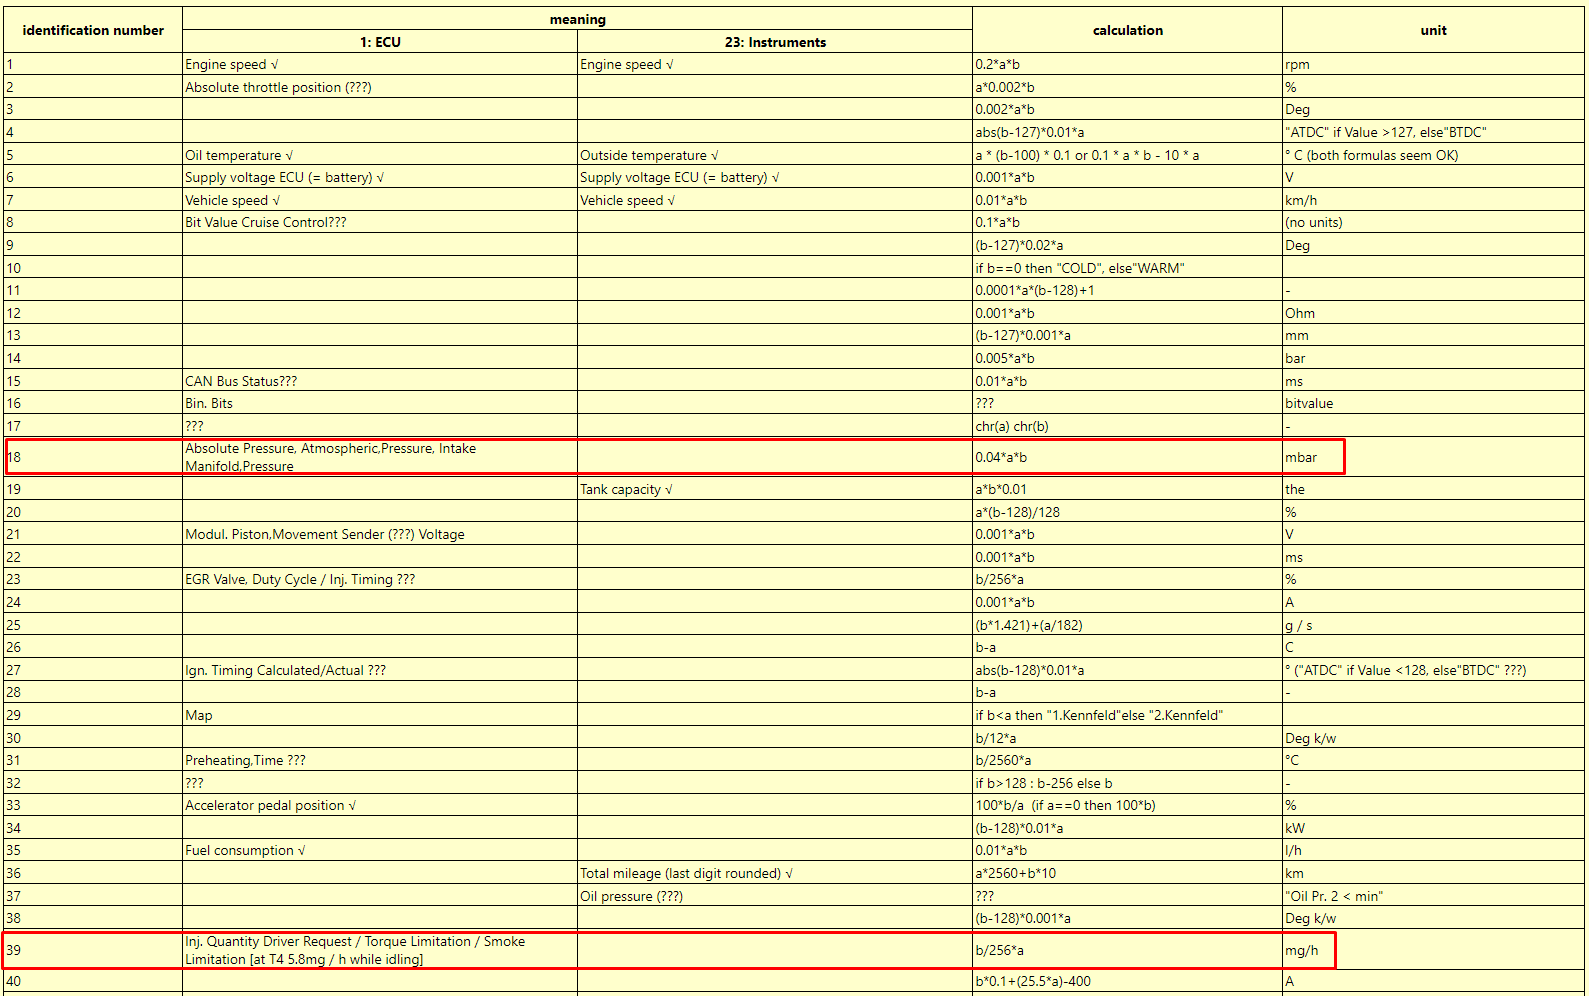
A complete list of all measuring block identifiers and their equivalent calculations can be found on this website: https://www.blafusel.de/obd/obd2_kw1281.html#7
Changing the Maximum Diagnostic Limit for Injected Quantity
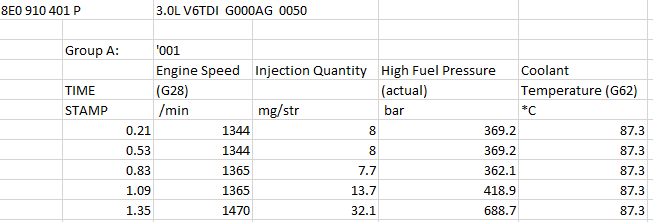
1. The first step is to open VCDS (or a LOG from VCDS) and check which group contains the value of the injected fuel quantity.
It is determined that Group 1 (Group 001) contains Injected Quantity in the second measuring block (Measuring Block 2).
2. The second step is to find the identifier of the measuring block in UACC_RSigBlkGrp_MAP. This map describes what is seen in VCDS as groups and measuring blocks.
The identifier value of the measuring block for the injected fuel quantity is determined to be 60.
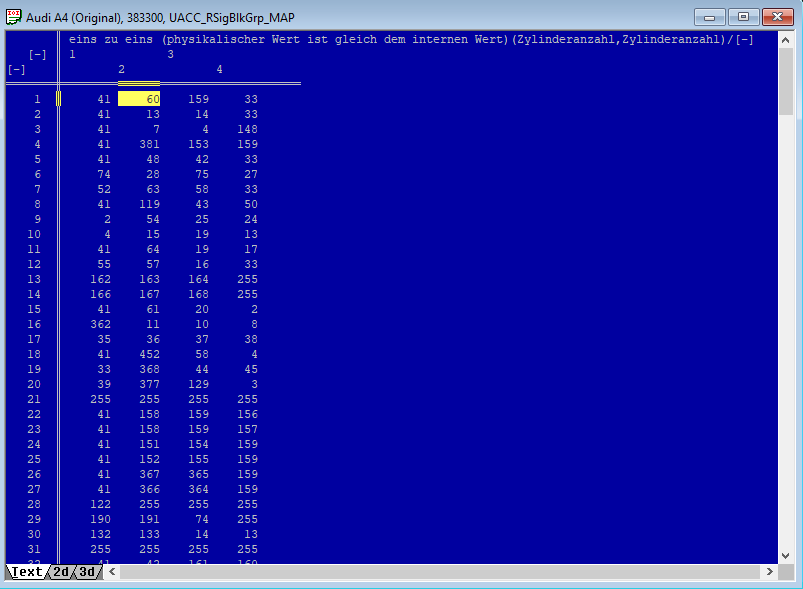
3. The third step is to check the identifier used by the protocol in UACC_ESBFormular_C. This map contains the „ID“ identifier, which instructs VCDS on how to calculate the actual measured values from the sensor.
The identifier value is determined to be 39.

4. The fourth step is to check the formula and measurement units of identifier 39.
Formula: (B/255)*A

5. The fifth step is to check parameter „A“ used by the protocol in UACC_ESBNormVal_C. This map contains the constant value of „A,“ which is used by VCDS to calculate the actual measured value from the sensor.
The value of A is determined to be 70.

6. The sixth step is to check the signal number in UACC_ESBSigNr_C. This map contains the signal number used by VCDS to calculate the actual measured value from the sensor.
The signal value is determined to be 222.

7. The seventh step is to find the signal name in the SigName table in the A2L file. This table contains the signal names according to their respective numbers.
The signal name is determined to be InjCtl_qCurr__q_DLen1
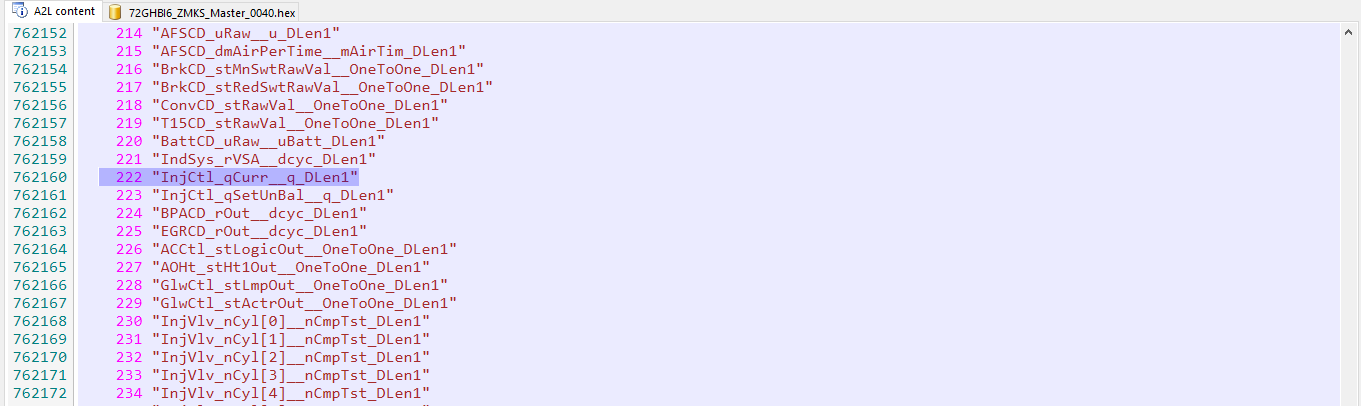
8. The eighth step is to check the scaling value and offset according to the signal name InjCtl_qCurr__q_DLen1.
Signal names always follow the format:
<Module>_<variablename>__<scale>_<length>
<InjCtl>_<qCurr>__<q>_< DLen1>
The scaling value and offset always follow the format:
sig_ <scale>DIAScale_C for scaling
sig_ <scale>DIAOffset_C for offset
This means that the scaling category for signal 222 is q
The scaling value is determined to be sig_qDIAScale_C = 0.037000
The offset value is determined to be sig_qDIAOffset_C = 0.00
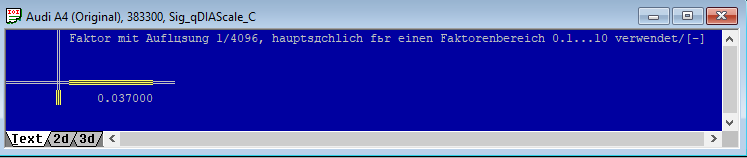
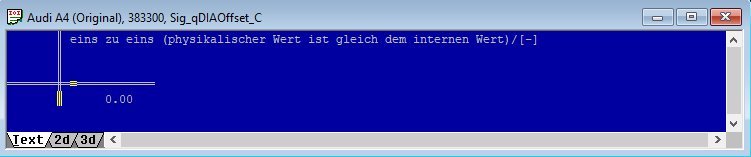
9. The ninth step is to modify the values so that a higher limit is obtained in VCDS.
According to the formula: (B/255)*A
Currently, parameter A is a constant equal to 70.
Parameter B represents the fuel quantity IQ, which is read from memory as a 16-bit value. However, the maximum value that can be transmitted is 8-bit, meaning a number from 0 to 255.
To determine the maximum diagnostic value, B=255 is substituted into the formula:
(B/255)*A = (255/255)*70 = 70mg/hub
It is known that 8-bit values range from 0 to 255, while 16-bit values range from 0 to 65535.
Since the fuel quantity read from memory cannot be directly transmitted for calculation, it must be converted into an 8-bit value. This is where the scaling value 0.037000 comes into play. The IQ calculation is performed as follows: 7000 * 0.037000 = 259, which is close to 255. The scaling value is not exact, but this is how it was set by the manufacturer!
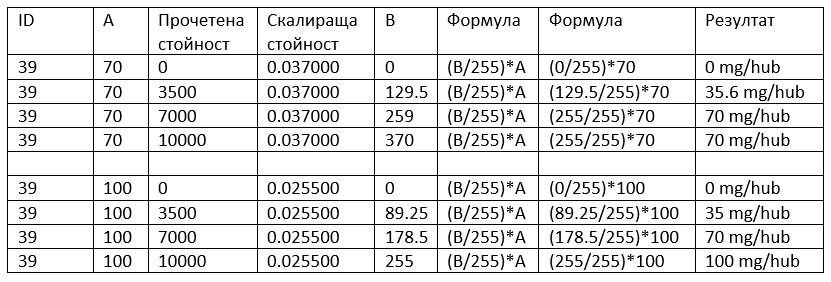
To increase the limit to, for example, 100mg/hub, the value of A in UACC_ESBNormVal_C must be set to 100. The formula then changes to: B/255*100.
If left at this stage, the interpretation of the fuel quantity read from memory would be incorrect, meaning that 70mg/hub would be displayed as 100mg/hub.
To complete the modification, the scaling value sig_qDIAScale_C is updated so that IQ 10000 is converted to 255. All that needs to be done is to divide 255/10000, which equals 0.0255.

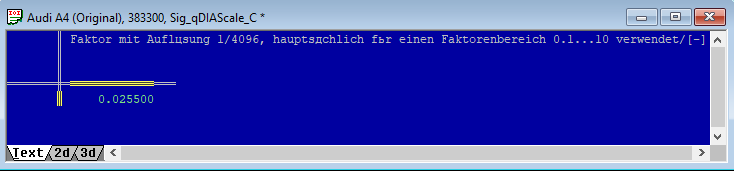
10. The tenth step is to find all measuring blocks that have the scaling category „q“ and modify their values in UACC_ESBNormVal_C so that they are correctly calculated by the formulas.
148 „InjCrv_qMI1Des__q_DLen1“
149 „InjCrv_qPiI1Des__q_DLen1“
150 „InjCrv_qPiI2Des__q_DLen1“
151 „InjCrv_qPiI3Des__q_DLen1“
152 „InjCrv_qPoI1Des__q_DLen1“
153 „InjCrv_qPoI2Des__q_DLen1“
222 „InjCtl_qCurr__q_DLen1“
223 „InjCtl_qSetUnBal__q_DLen1“
236 „InjVlv_qFBCCyl[0]__q_DLen1“
237 „InjVlv_qFBCCyl[1]__q_DLen1“
238 „InjVlv_qFBCCyl[2]__q_DLen1“
239 „InjVlv_qFBCCyl[3]__q_DLen1“
240 „InjVlv_qFBCCyl[4]__q_DLen1“
241 „InjVlv_qFBCCyl[5]__q_DLen1“
311 „FMTC_qStrt__q_DLen1“
318 „FlMng_qLimSmk__q_DLen1“
606 „InjCrv_qLmbdCtl__q_DLen1“
624 „PFlt_qFl_mp__q_DLen1“
1064 „FMA_qAct_mp__q_DLen1“
1065 „FMA_qCtl_mp__q_DLen1“
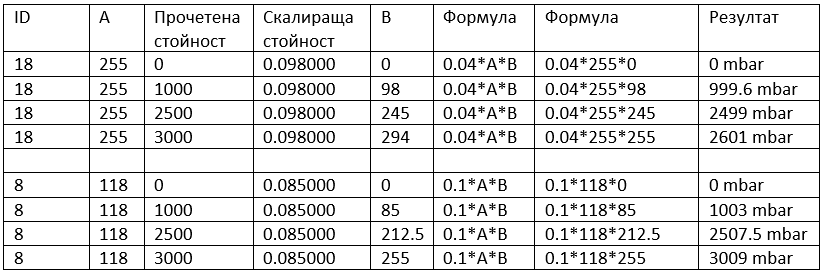
11. The table below shows the values visualized by VCDS before and after the changes.
Changing the Maximum Diagnostic Limit for Boost Pressure
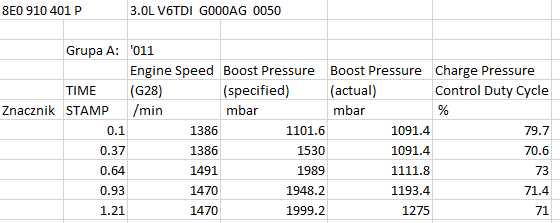
1. The first thing we need to do is open VCDS (or a LOG from VCDS) and check which group contains the value of the Boost Pressure.
We determine that Group 111 (Group 011) contains Boost Pressure (specified) and Boost Pressure (actual), respectively, in the second and third measuring blocks (Measuring Block 2, Measuring Block 3).
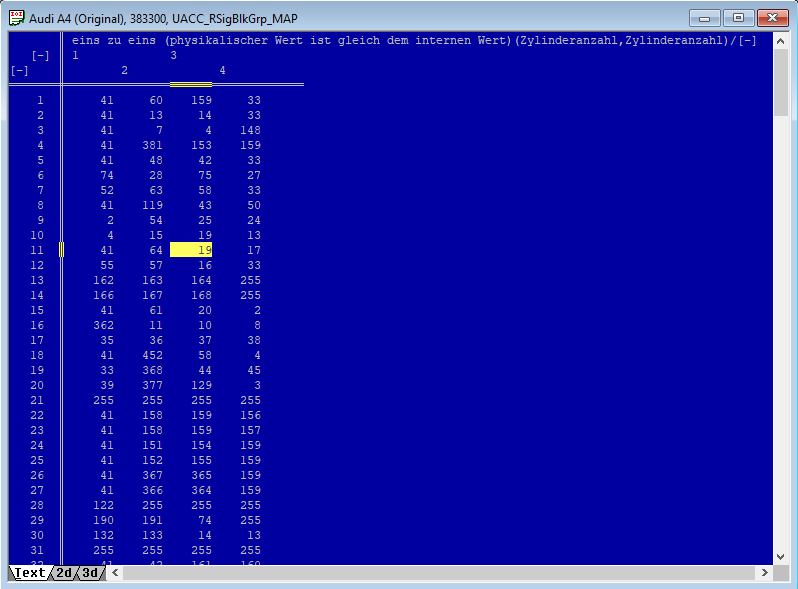
2. The second step is to find the identifier of the measuring block in UACC_RSigBlkGrp_MAP. This map describes what you see in VCDS as groups and measuring blocks.
We determine the identifier value of the measuring block for the injected fuel quantity – 19.
3. The third step is to check the identifier used by the protocol in UACC_ESBFormular_C. This map contains the identifier „ID,“ which tells VCDS how to calculate the actual measured values from the sensor.
We determine the identifier value – 18.

4. The fourth step is to check the formula and measurement units of identifier 18.
Formula: 0.04*A*B

5. The fifth step is to check the parameter „A“ used by the protocol in UACC_ESBNormVal_C. This map contains the constant value of „A,“ which VCDS uses to calculate the actual measured value from the sensor.
We determine the value of A – 255.

According to the formula: 0.04*A*B
If we substitute A and B with the maximum value of 255, we get: 0.04*255*255 = 2601mbar
To achieve a value greater than 2601mbar, we need to change the calculation formula.
Reviewing all formulas from the table, we determine that the most suitable is Formula 8 – 0.1 * A * B, since it has no units and after calculation, we can achieve a maximum value of 6502mbar.

The formula is clear, but now we need to set a reasonable maximum that you know you won’t exceed. For example, 3000mbar, which has a precision of 11.8mbar.
3000mbar / 255 = 11.8mbar precision
6502mbar / 255 = 25.5mbar precision
6. The sixth step is to change the value in UACC_ESBFormular_C. We change 18 to 8.

7. The seventh step is to check the signal number in UACC_ESBSigNr_C. This map contains the signal number used by VCDS to calculate the actual measured value from the sensor.
We determine the signal value – 304.

8. The eighth step is to find the signal name in the SigName table in the A2L file. This table contains the signal names according to their number.
We determine the signal name – BPSCD_pFltVal__p_DLen1.
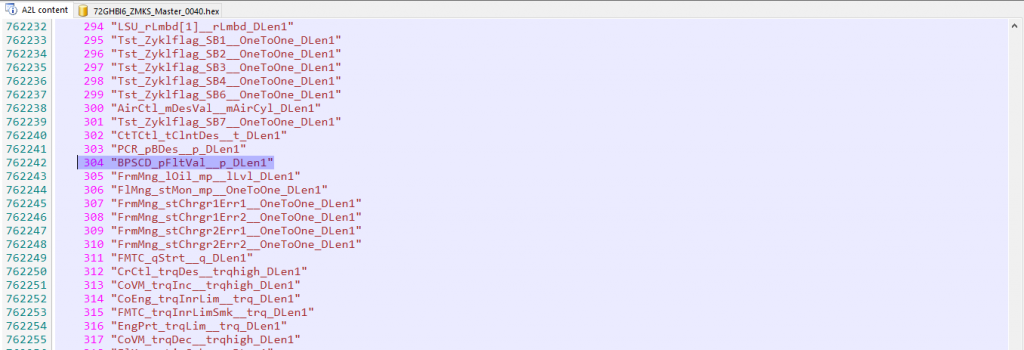
9. The ninth step is to check the scaling value and offset according to the signal name BPSCD_pFltVal__p_DLen1.
Signal names always follow the format:
<Module>_<variablename>__<scale>_<length>
<BPSCD>_<pFltVal>__<p>_<DLen1>
The scaling and offset values always follow the format:
sig_<scale>DIAScale_C for scalingsig_<scale>DIAOffset_C for offset
This means that the scaling category for signal 304 is p.
Offset value: sig_pDIAOffset_C = 0.00
Scaling value: sig_pDIAScale_C = 0.098000
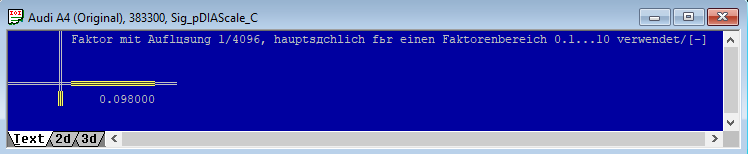
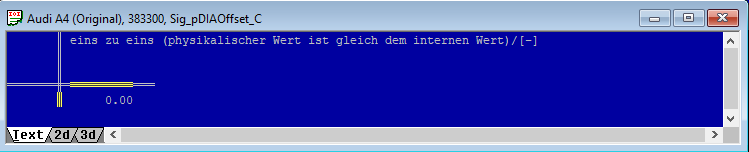
10. The tenth step is to modify the values so that we obtain a higher limit in VCDS.
According to the new formula: VCDS Value = 0.1*A*B
We calculate parameter A = VCDS Value / (0.1*B) => 3000mbar / (0.1*255) = 117.647
We round A = 118 and write the new value in UACC_ESBNormVal_C.

Checking: VCDS Value = 0.1*118*255 = 3009 mbar
Parameter B is the turbo pressure – Boost Pressure, which is read from memory as a 16-bit value. However, the maximum value that can be transmitted is 8-bit, meaning a value from 0 to 255.
We know that 8-bit values range from 0 to 255, while 16-bit values range from 0 to 65535.
Since we obviously cannot directly transmit the value read from memory for calculation, we need to convert it to an 8-bit value. This is where the scaling value 0.098000 helps.
Calculation:Boost Pressure = 2601 * 0.098000 = 202, which is close to 255.
The scaling value is not exact, but this is how it was set from the factory!
To finalize the change, we update the scaling value sig_pDIAScale_C, so that Boost Pressure 3009mbar is converted as 255.
Final calculation:255 / 3009 ≈ 0.085000
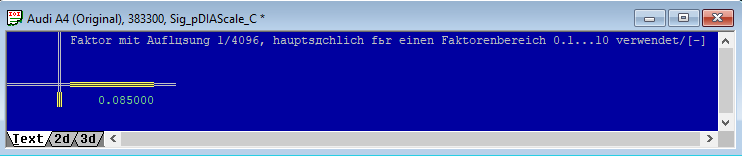
11. The eleventh step is to find all measuring blocks that have the scaling category „p“ and modify their values in UACC_ESBNormVal_C so that they are correctly calculated by the formulas.
203 „BPSCD_pOutVal__p_DLen1“
204 „APSCD_pVal__p_DLen1“
303 „PCR_pBDes__p_DLen1“
304 „BPSCD_pFltVal__p_DLen1“
391 „BPSCD_pLin__p_DLen1“
402 „PFltCD_pDiff__p_DLen1“
609 „EGSys_pExhGas__p_DLen1“
615 „PFlt_pPre__p_DLen1“
1040 „EGRCD_pDiff__p_DLen1“
1041 „EGRCD_pDiffHigh__p_DLen1“
12. The table below shows the values visualized by VCDS before and after the changes.