


ECU Remap Guide – EDC16C31. BMW E60 530D 218HP – Stage 1
28.03.2025This short guide provides step-by-step instructions for a Stage 1 remap of the BMW E60 530D 218HP with the EDC16C31 ECU. It is designed for enthusiasts looking to unlock more engine potential and perform the remap themselves. I have simplified the process to make it as clear as possible.
If you have any questions, feel free to message me directly on Facebook Messenger: https://www.facebook.com/aliantauto.
Before You Start
If you are unfamiliar with key diesel engine components—such as the turbocharger, turbocharger controller, and sensors like MAF, MAP, and FRP—or the common rail fuel injection system, and cannot dedicate at least 2-3 hours a day for 1-3 months to learning the fundamentals and testing your attempts, this guide may not be suitable for you.
For complete beginners, it might be better to read the articles in the General section before going through this guide.
What You Need for a Successful Stage 1 Remap
- Car: BMW E60 530D 218HP with an EDC16C31 ECU.
- Diagnostic Tool: Used to log real-time data after each modification.
- Examples: Testo, Bimmerlink, Deep OBD.
- ECU Programming Tool: Required to read the original file and write modified files.
- Examples: MPPS, Galletto v54; Kess V2.
- Battery Stabilizer: It is recommended to maintain stable voltage during the reading and writing files.
- Example: GYSFLASH 100.12 HF.
- WinOLS Software: A specialized tool for modifying ECU memory content, making it easier to find and edit maps.
Key Guidelines
Before modifying any factory settings, you must evaluate the vehicle’s current condition by logging essential parameters such as: Mass airflow, Turbo pressure, Rail pressure, Injector corrections, Fuel mixture, etc. For diesel engines, logging should be done in 3rd or 4th gear, from 1200 to 4500 RPM, at 100% throttle. Use specialized software and interfaces compatible with your car brand. If you detect deviations from factory parameters, resolve them before making any modifications to the ECU file!
When you are a beginner and lack experience, I advise you to change parameters in small increments and monitor how they affect the vehicle through logging. If at any point you do not know or are unsure of the consequences of certain changes, it is best to do nothing and continue searching for information!
By following these guidelines, you can successfully complete a Stage 3 remap and enhance your vehicle’s performance while minimizing risks.
Example Stage 1. Includes the following modifications to the vehicle:
- Custom Downpipe and Exhaust System
- EGR removed
Here, I will describe the main maps required for this specific Stage 1, which includes increasing the power to around 260HP and 600NM. I provide brief explanations for each type of map, while all other maps are uploaded to the respective album on my Facebook page.
If you have any questions or would like me to send you a package with all maps (Mappack.kp), please send a private message to my Facebook Messenger: https://www.facebook.com/aliantauto.
1. Driver Wish maps
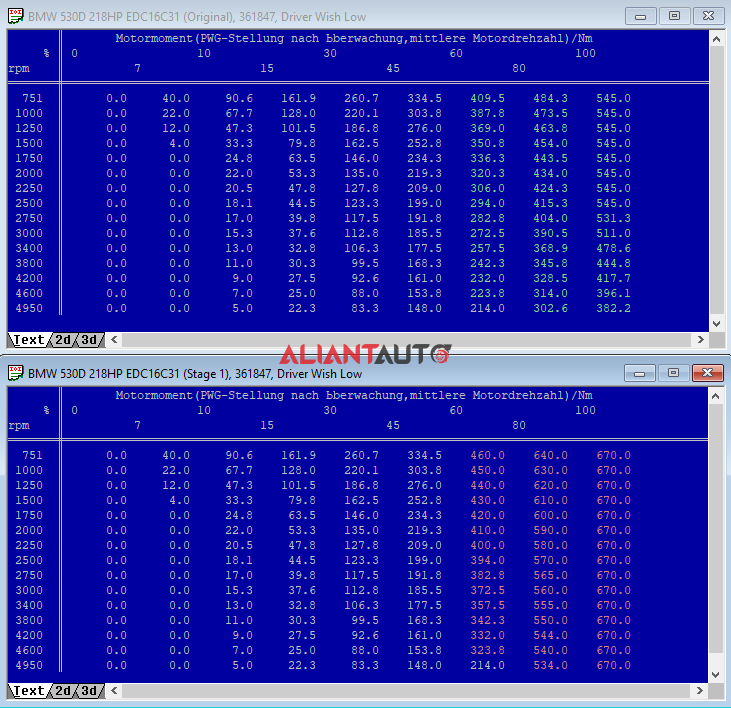
These maps define the required torque based on engine RPM and throttle pedal position in percentages (%). Adjustments are made according to the driver’s preferences, with the highest desired NM value always set at 100% throttle pedal position.
What should be done?
Every adjustment starts with these maps. In this case, the target is a maximum (External) torque of around 600NM. At 100% throttle pedal position, the (Internal) torque is set to around 670NM. Values are gradually increased for other pedal position levels to enhance the sense of power with lighter throttle input and improve acceleration.
Important: Modifying only these maps does not achieve the desired effect, as torque may still be limited by other maps with different functions, which we will examine below. It is important to remember that torque limitation can be imposed by different function maps, but the one with the lowest torque value will be applied!

2. Torque Maps
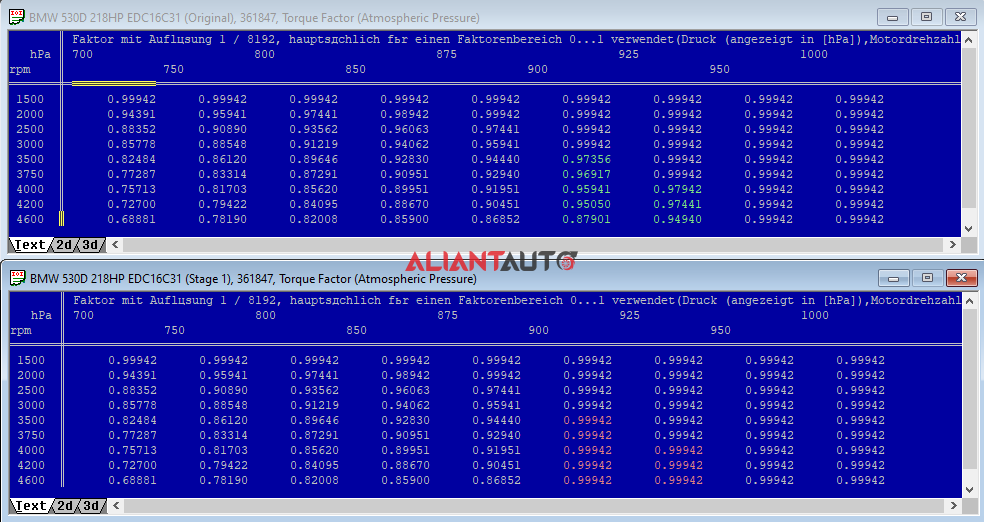
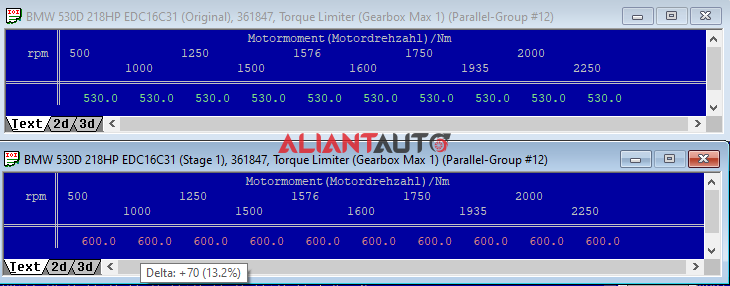
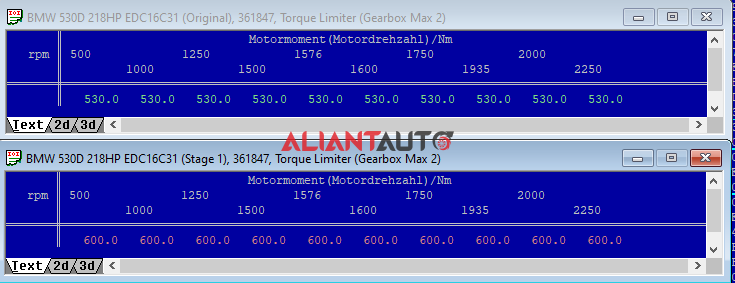
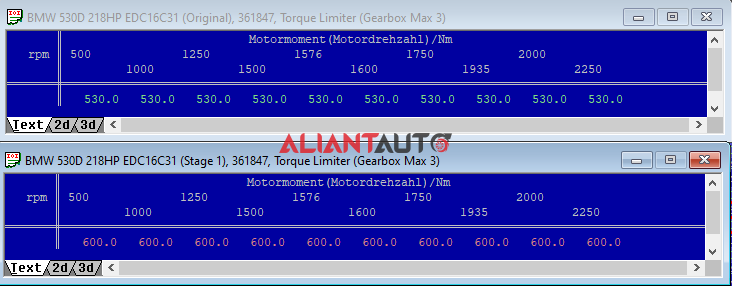
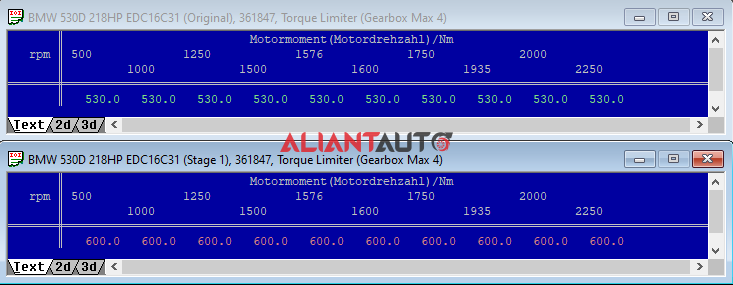
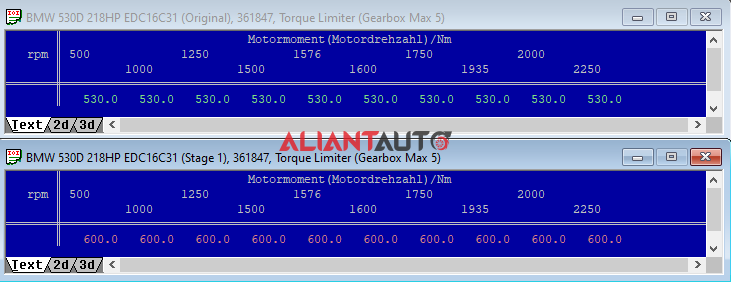
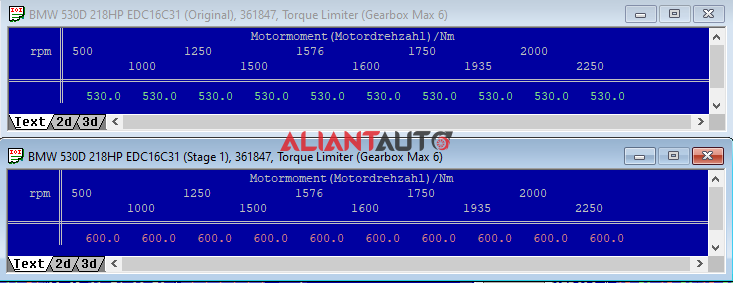
These maps are used to limit the torque based on engine RPM and other parameters to protect the engine from mechanical and thermal overloads. The result of these maps is torque measured in NM.
What should be done?
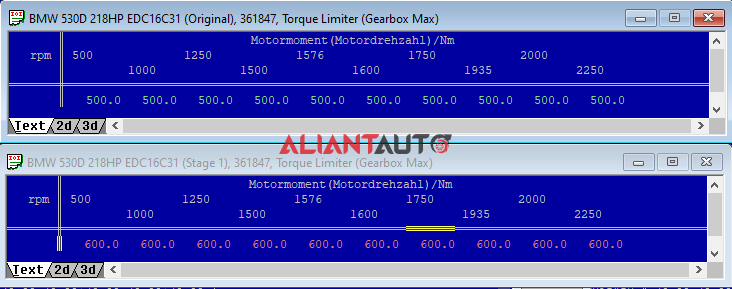
All torque maps are located and adjusted to achieve final (External) torque values of approximately 600NM.
Note: It is necessary to consider the so-called internal (Internal) and external (External or Flywheel) torque maps. All torque limitation maps related to the transmission are External. The values in the maps for torque conversion to injected fuel quantity, Limp Mode maps, and all others are Internal. The main purpose of this distinction is to calculate the actual torque used by the automatic transmission control unit (TCU).
Internal Torque – Friction Torque = External Torque (Output Torque at Flywheel)




3. Torque to IQ Maps
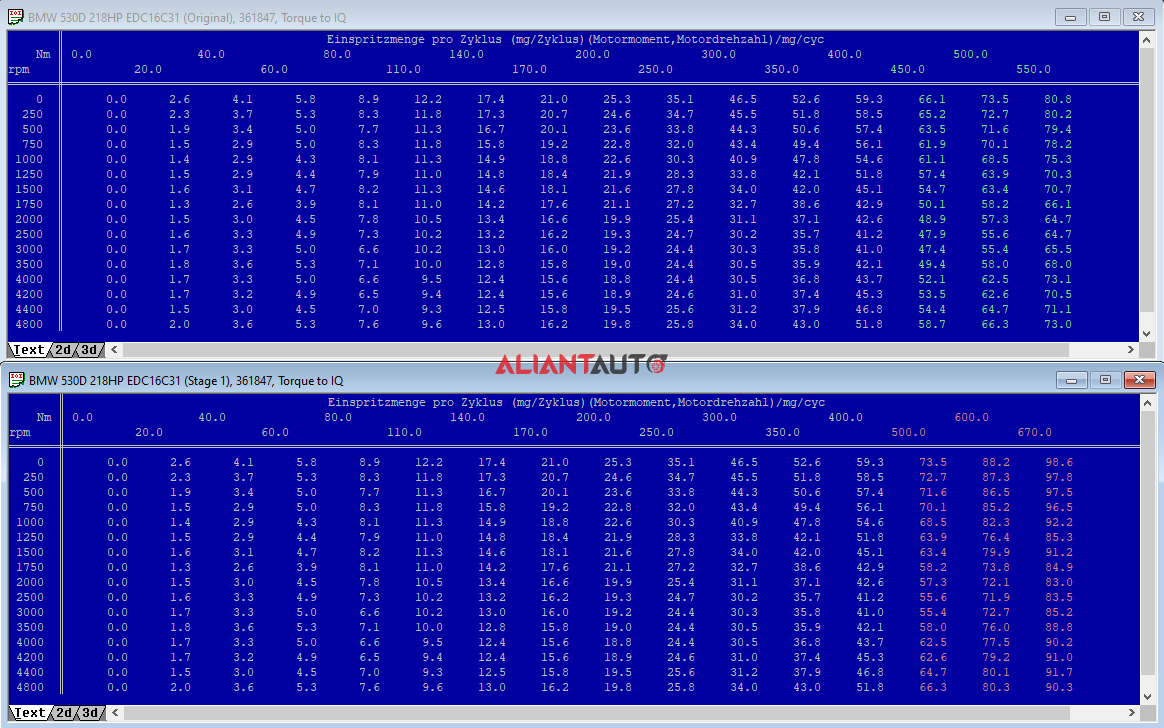
These maps are used to convert the requested torque (NM) into the amount of injected fuel (IQ) based on engine speed (RPM). As a result, the injected fuel quantity IQ is obtained in mg/hub.
What should be done?
Since the original map is calibrated up to 550NM (Internal) and the goal is a higher torque output, extrapolation is performed up to 670NM (Internal).Note: These maps can be used to limit the injected fuel at certain RPM levels when the Lambda maps are not sufficient.
Attention!
When an automatic transmission is present, the conversion maps should always be extrapolated rather than de-calibrated! The TCU requires correct torque values from the ECU; otherwise, transmission damage may occur!
4. Lambda Maps
These maps are used to limit the injected fuel quantity (IQ) based on engine speed (RPM) and the measured or estimated air mass (mg/hub). The output of these maps is the Lambda value or the AFR (Air-Fuel Ratio), which determines the fuel mixture.
What should be done?
These maps, roughly speaking, determine the amount of smoke emitted from the exhaust system. This smoke results from unburned fuel. Generally, the maps are adjusted to ensure no visible smoke appears in the mirror, indicating efficient combustion.Important: The optimal ratio for power, reliability, and minimal smoke levels in tuned vehicles is Lambda 1.1 – 1.2 (AFR 16 – 17.5). Deviating from this range will compromise at least one of these three aspects – an excessively rich mixture can damage the DPF (if present), turbocompresor or even the engine!

5. SOI Maps
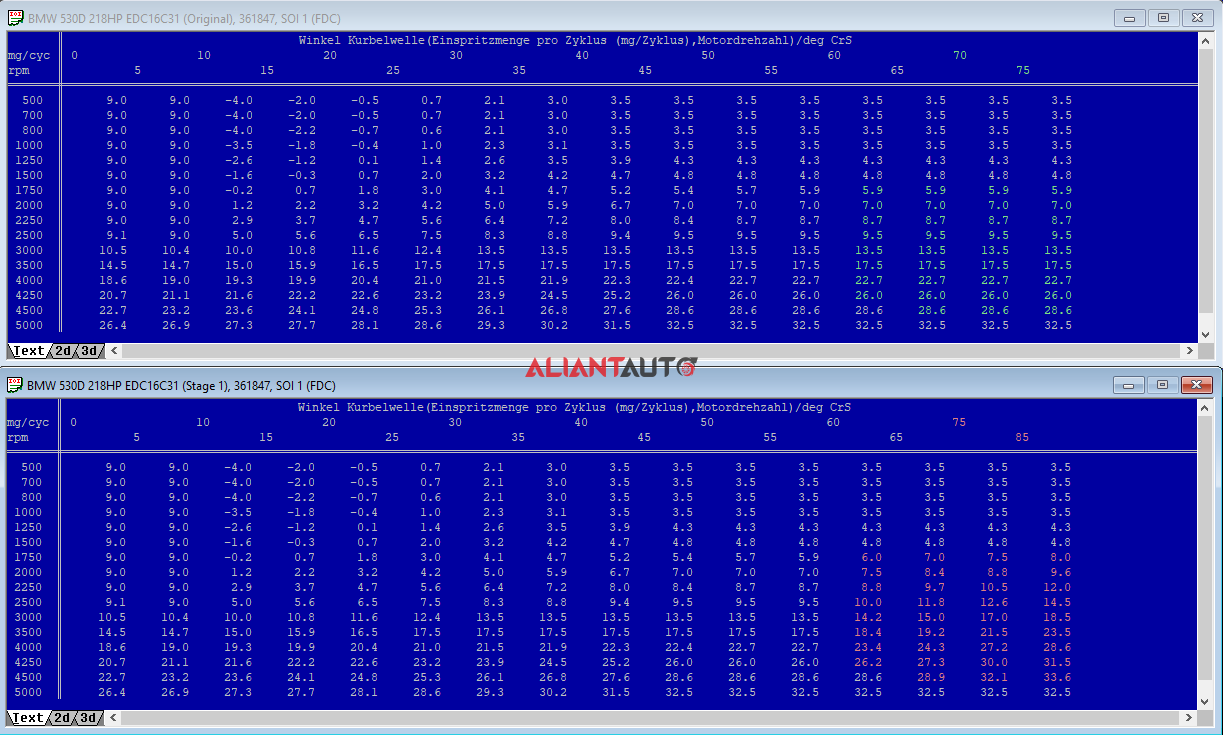
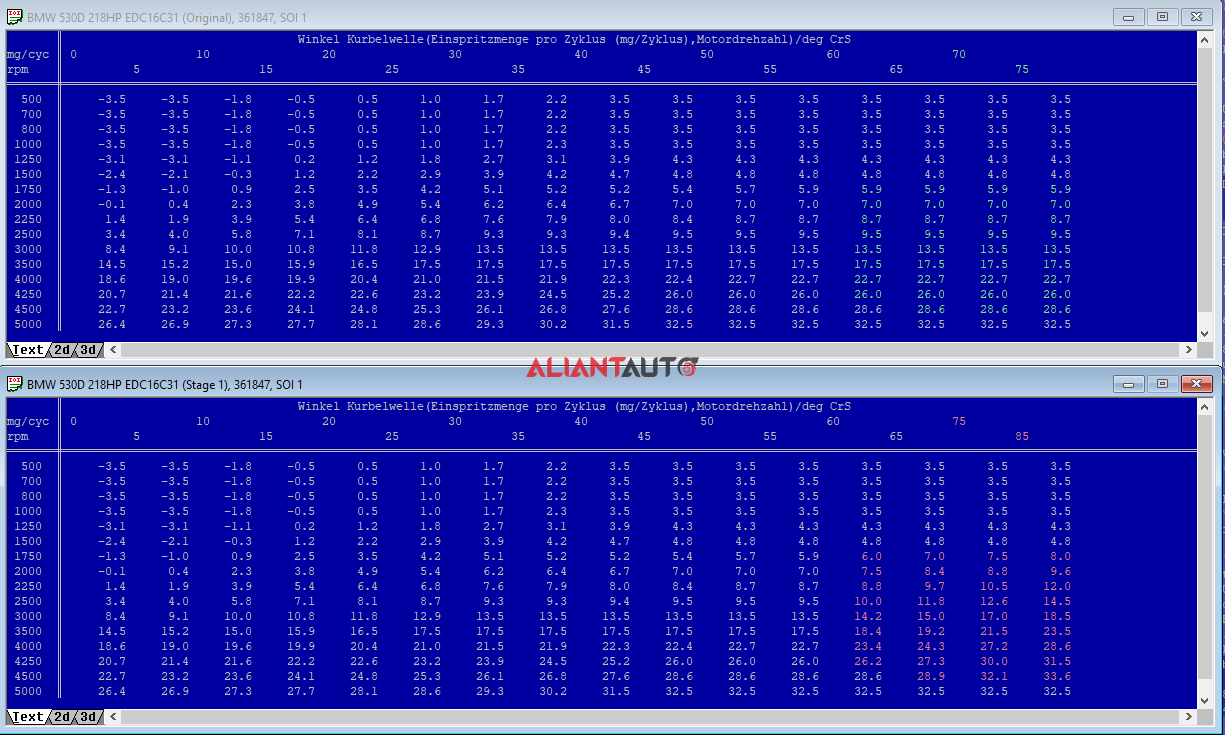
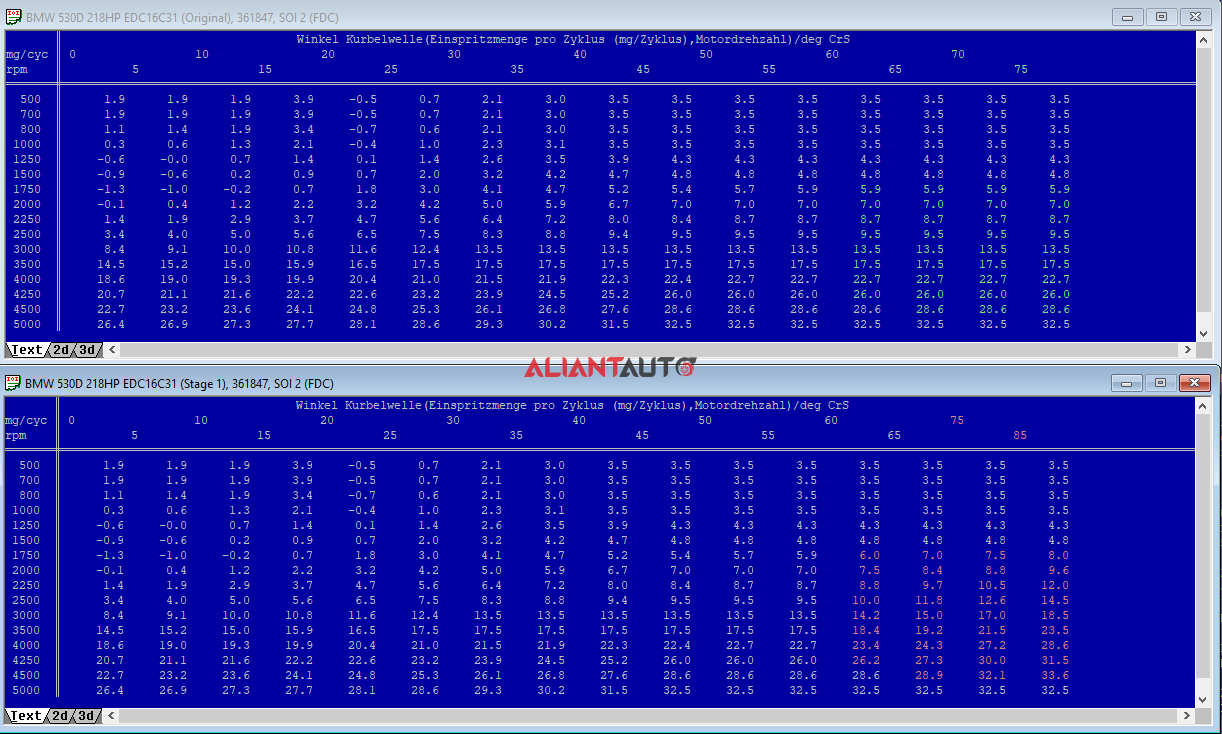
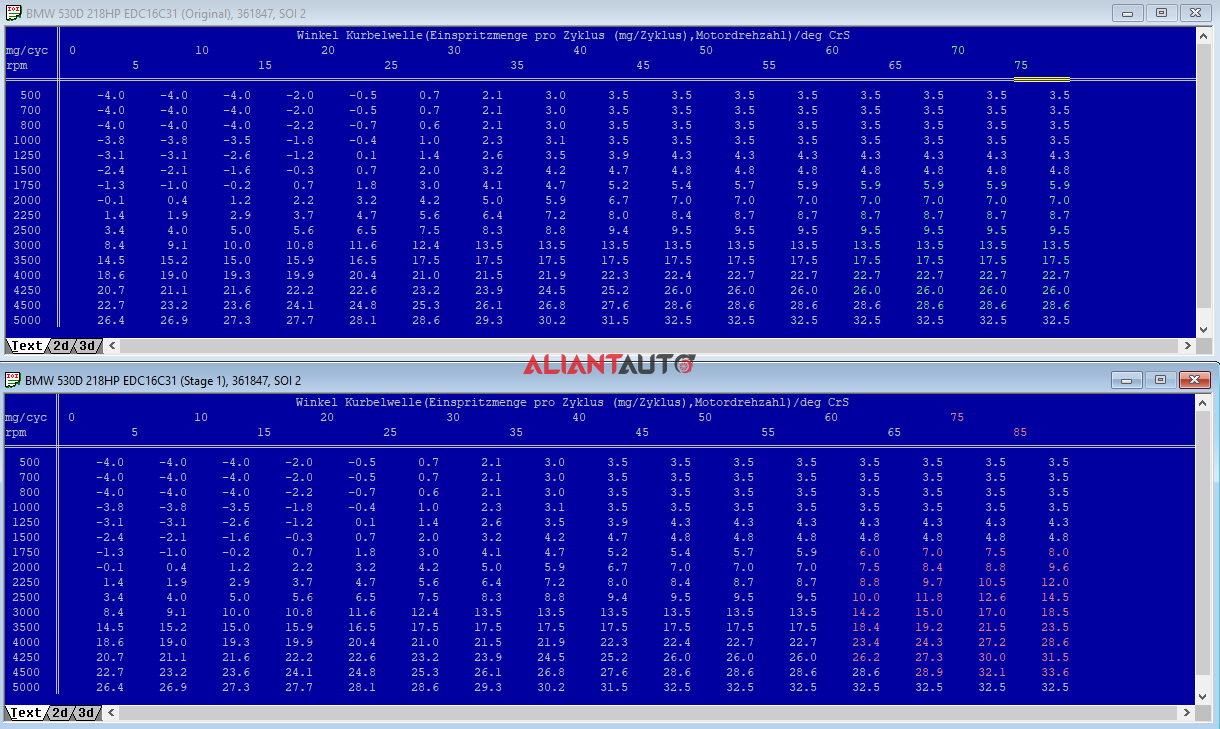
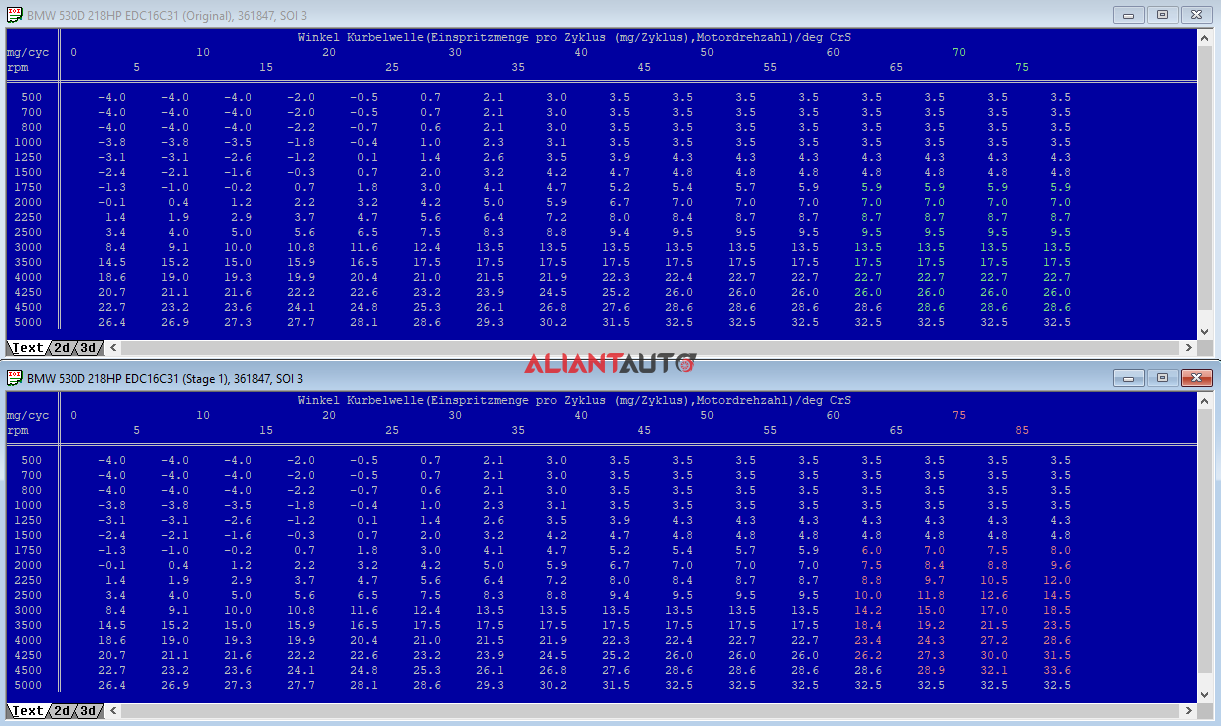
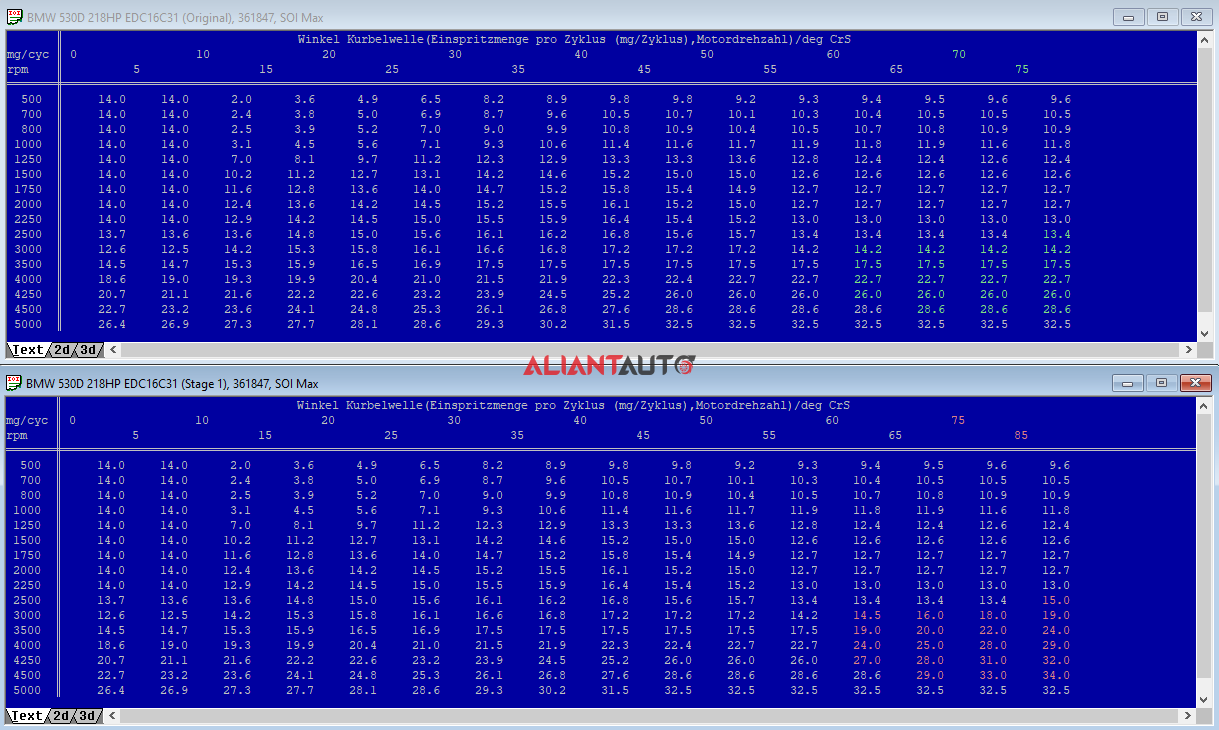
These maps are used to define the start of the main fuel injection into the cylinder. The X and Y axes represent engine speed (RPM) and the desired fuel quantity (IQ). The results of these maps are expressed in crankshaft degrees before and after the top dead center (BTDC and ATDC).
What should be done?
The start of the main fuel injection (SOI) is increased as engine speed rises. The goal is to inject up to 85 mg/hub of fuel, while the original maps are defined for lower values. Extrapolation is performed up to 85 mg/hub. Specialized software can be used to calculate the end of injection (EOI) based on injection duration and rail pressure. In principle, increasing SOI is a method for increasing power and reducing EGT. However, it should be noted that peak cylinder pressure (PCP) also rises due to the increased amount of fuel before the piston reaches the top dead center. Each engine has an optimal SOI setting, and efficiency declines if this optimal range is exceeded.
Attention! Excessively high PCP (maximum cylinder pressure) may lead to engine damage!
6. Duration Map
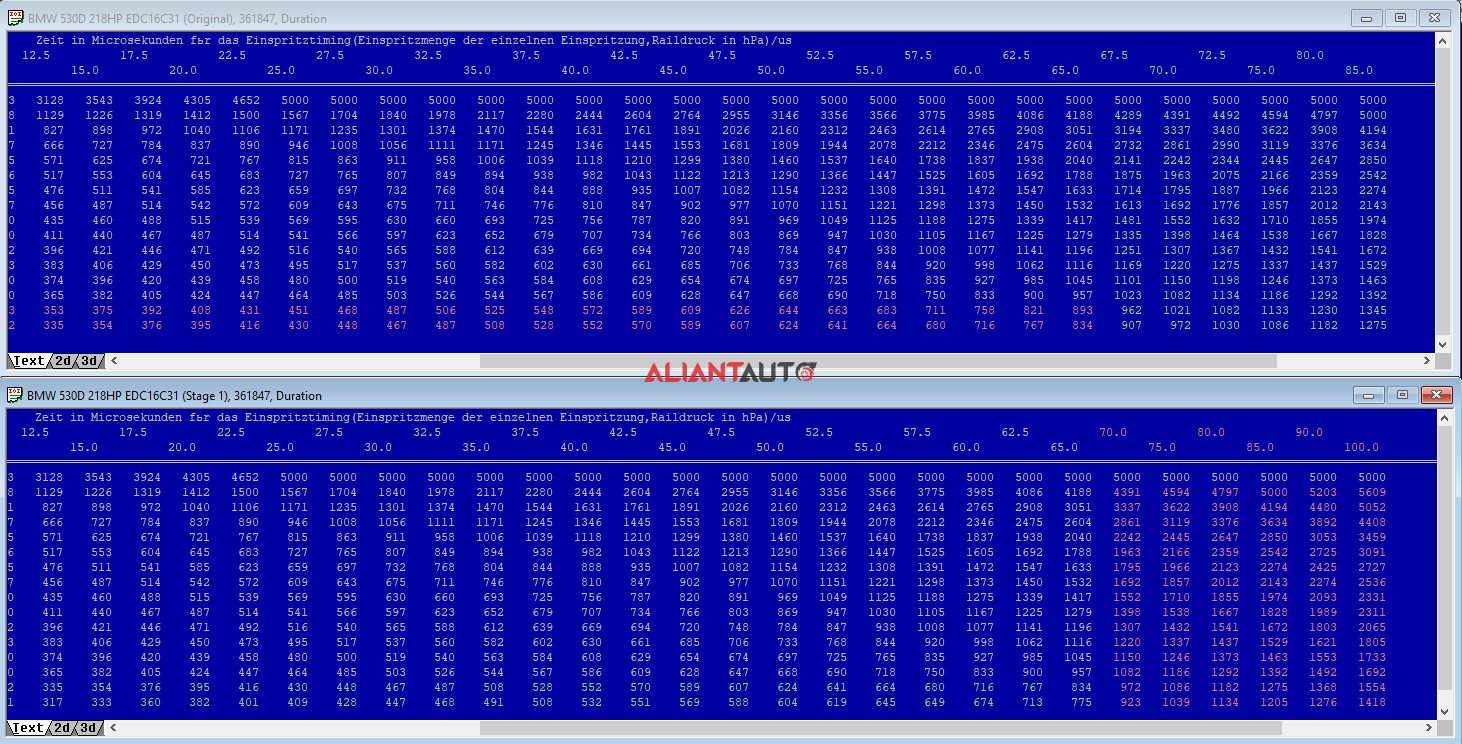
This map is used to define the fuel injection duration, or in other words, the time for which the injector remains open. The X and Y axes represent the desired fuel quantity (IQ) and the current rail pressure. The result of this map is the injection duration in microseconds (µs).
What should be done?
The duration of the main fuel injection (DOI) decreases as rail pressure increases. The goal is to inject up to 80-85 mg/hub of fuel, but the original map is defined only up to approximately 71 mg/hub (85 mm3/hub × 0.835 = 70.98 mg/hub). Extrapolation is performed up to 100 mm3/hub (83.5 mg/hub). The rail pressure is set up to 1700 bar.
Note: As a general rule, the Duration map should not be modified. Adjustments are required only if:
- The injectors are replaced with larger ones;
- More fuel needs to be injected beyond the maximum defined quantity;
- The maximum rail pressure needs to be increased.
Attention!
It should be taken into account that injection duration consists of:
- Opening time – when the injector starts to open (fuel flow changes rapidly during this time).
- Fully open phase – when the injector is completely open (fuel flow remains relatively constant).
- Closing time – when the injector is closing (similar to the opening phase).
Additionally, it should not be overlooked that the length of the first and third phases strongly depends on rail pressure. Even though a formula can be used to estimate the injected fuel quantity for a given rail pressure, the calculation is complex and not 100% precise.

7. Rail Pressure Maps
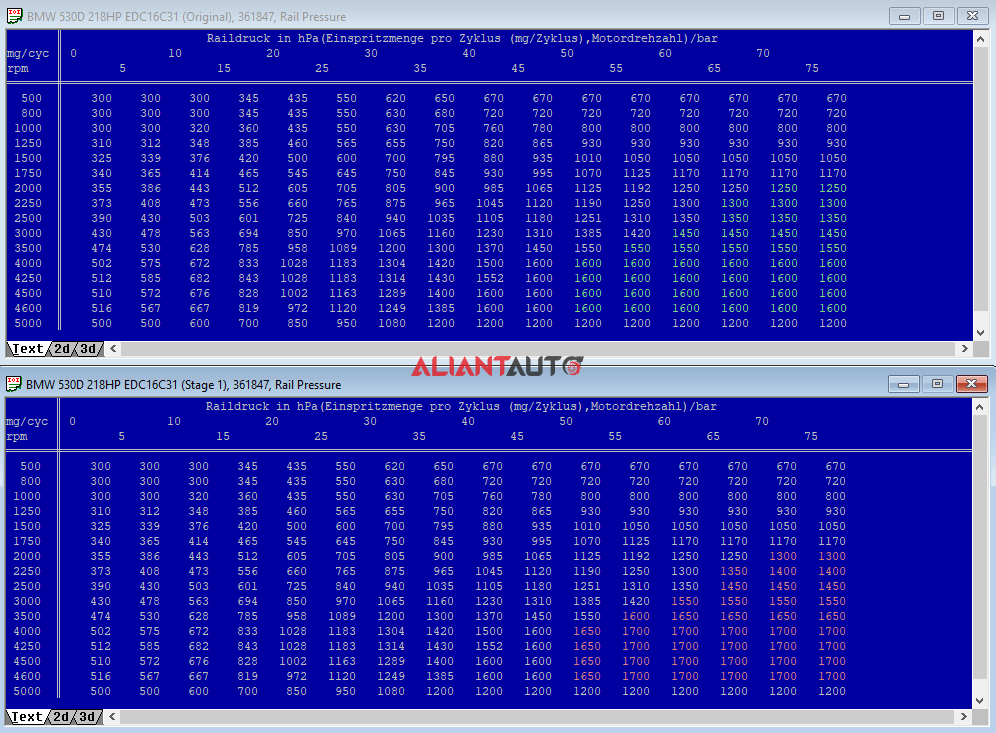
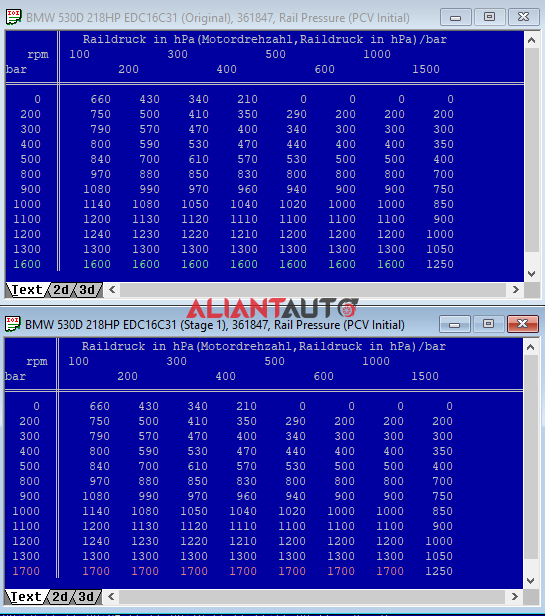
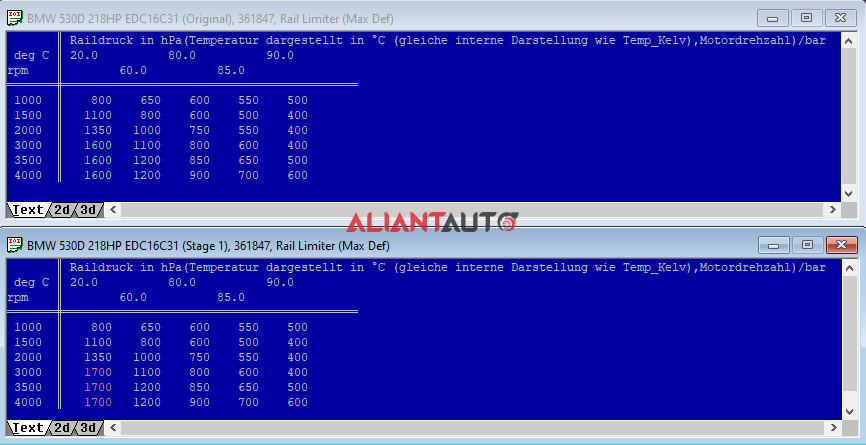
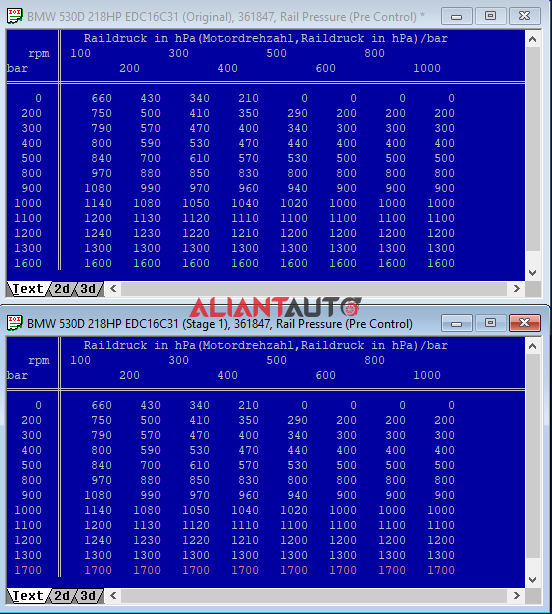
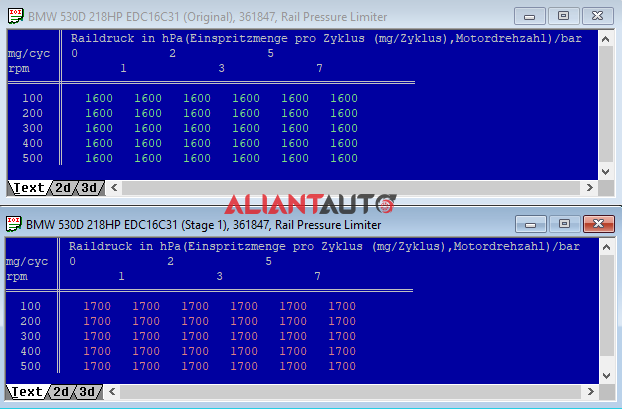
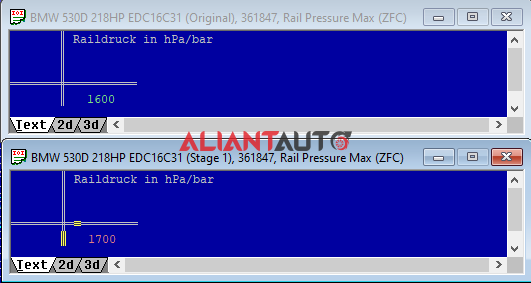
These maps are used to define the fuel pressure in the rail. The X and Y axes represent engine speed (RPM) and the desired fuel quantity (IQ). The results of these maps are the fuel pressure in the rail (hPa).
What should be done?
The pressure is increased to maximum values of 1700 bar, which helps ensure an optimal End of Injection (EOI). The maximum pressure is set according to the desired fuel quantity and the capacity of the high-pressure pump.
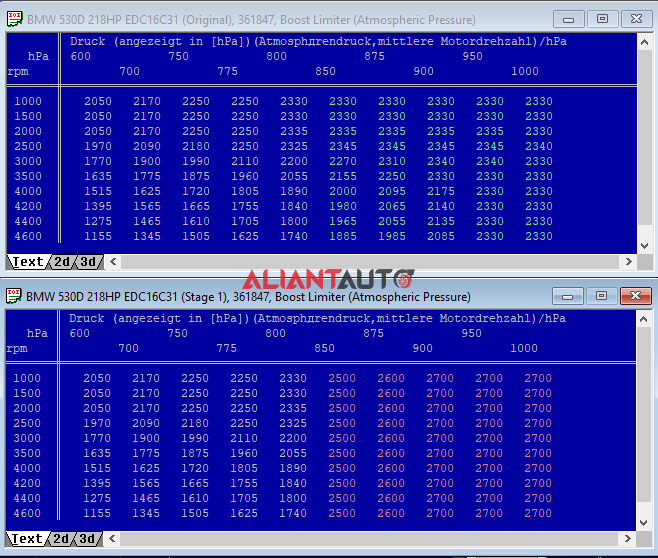
8. Boost Pressure Maps
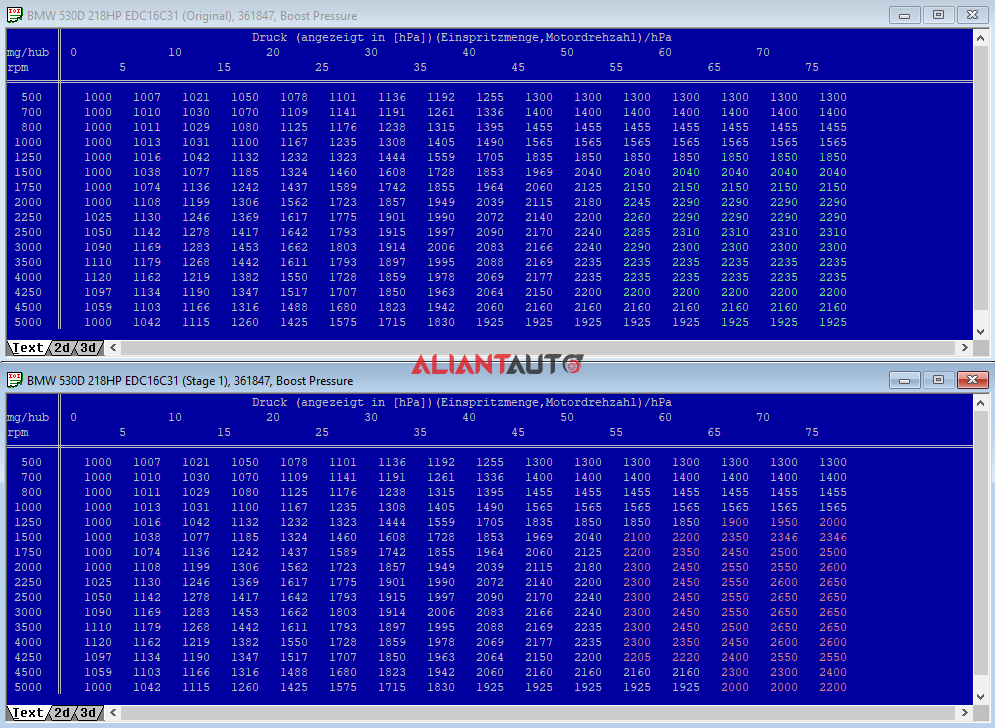
These maps are used to define the pressure of compressed air from the turbocharger. The X and Y axes represent engine speed (RPM) and the desired fuel quantity (IQ). The result of these maps is the compressed air pressure (hPa).
What should be done?
Since the goal is to inject up to 85 mg/hub at full load, the necessary amount of air must be ensured by increasing the turbocharger pressure. An absolute pressure of 2.65 bar is required, which will provide the necessary air quantity for a Lambda value of around 1.10 (AFR 16.0). The pressure is increased to a maximum value of 2650 hPa.
9. Boost Pressure Control Maps
These maps define the approximate position of the actuators that control both turbochargers. The X and Y axes represent engine speed (RPM) and desired fuel quantity (IQ). The result of these maps is the approximate actuator position in percentages (%).
Why is the actuator position called approximate?
The control valve positions constantly fluctuate between fully open and fully closed. For the ECU to control these valves effectively, it must have a predefined reference for their expected position in different scenarios. The boost pressure control maps provide values close to the target, determined by fuel quantity and RPM. In some situations, the ECU dynamically adjusts these values in real-time, meaning the values in the maps may differ from those read via diagnostic tools. The more accurately the control maps are set, the better the turbocharger control will be, and the ECU’s PID correction will be minimal.
Important: If the values in the maps significantly deviate from actual conditions, the ECU cannot adequately adapt these values in real-time, and this should not be relied upon!
What should be done?
Fine-tuning these maps can be difficult and time-consuming, as they must work in full synchronization. Calibration is always performed using detailed logs, but only after boost pressure and fuel adjustments. This is because these fundamental parameters determine how pressure is distributed between the two turbochargers. Every car and hybrid turbocharger reacts differently to tuning. Poorly designed hybrids may make stable tuning impossible, leading to boost pressure fluctuations or overboost issues!


